Pair correlation function
Collection of functions used to estimate the pair correlation function of an isotropic point process. The underlying routines call the R package spatstat.
estimate(): Estimates the pair correlation function.interpolate(): Cleans, interpolates, and extrapolates the results ofestimate().plot(): Plots the results ofestimate().
- structure_factor.pair_correlation_function.estimate(point_pattern, method='fv', install_spatstat=False, **params)[source]
Estimate the pair correlation function (pcf) of a point process encapsulated in
point_pattern(only for stationary isotropic point processes of \(\mathbb{R}^2\)). The available methods are the methodsspastat.core.pcf_pppandspastat.core.pcf_fvof the R package spatstat.Warning
This function requires the R programming language to be installed on your local machine but, it doesn’t require any knowledge of the programming language R.
- Parameters
point_pattern (
PointPattern) – Realization of the underlying point process.method (str, optional) – Trigger the use of the routine pcf.ppp or pcf.fv according to the value
"ppp"or"fv". These 2 methods approximate the pair correlation function of a point process from one realization encapsulated inpoint_pattern. For more details see [BRT15]. Defaults to"fv".install_spatstat (bool, optional) –
If
True, the R package spatstat will be automatically updated or installed (if not present) on your local machine, see also spatstat-interface. Note that this requires the installation of the R programming language.
- Keyword Arguments
params (dict) –
if
method = "ppp"keyword arguments of spastat.explore.pcf.ppp, ex: r, correction …
if
method = "fv"Kest = dict(keyword arguments of spastat.explore.Kest), ex: rmax …
fv = dict(keyword arguments of spastat.explore.pcf.fv), ex: method, spar …
- Returns
output of spastat.explore.pcf.ppp or spastat.explore.pcf.fv. The first column of the DataFrame is the set of radii on which the pair correlation function was approximated. The others correspond to the approximated pair correlation function with different edge corrections.
- Return type
pandas.DataFrame
Example
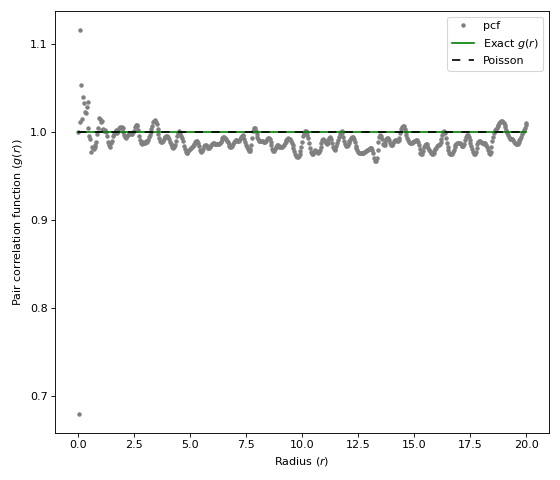
import matplotlib.pyplot as plt

import structure_factor.pair_correlation_function as pcf
from structure_factor.point_processes import HomogeneousPoissonPointProcess
from structure_factor.spatial_windows import BallWindow

point_process = HomogeneousPoissonPointProcess(intensity=1)
window = BallWindow(center=[0, 0], radius=40)
point_pattern = point_process.generate_point_pattern(window=window)

pcf_estimated = pcf.estimate(
    point_pattern, method="fv", Kest=dict(rmax=20), fv=dict(method="c", spar=0.2)
)

pcf.plot(
    pcf_estimated,
    exact_pcf=point_process.pair_correlation_function,
    figsize=(7, 6),
    color=["grey"],
    style=["."],
)
plt.tight_layout(pad=1)
(Source code, png, hires.png, pdf)
 Definition
The pair correlation function of a stationary isotropic point process \(\mathcal{X}\) of intensity \(\rho\) is the function \(g\) satisfying (when it exists),
\[\mathbb{E} \bigg[ \sum_{\mathbf{x}, \mathbf{y} \in \mathcal{X}}^{\neq} f(\mathbf{x}, \mathbf{y}) \bigg] = \int_{\mathbb{R}^d \times \mathbb{R}^d} f(\mathbf{x}+\mathbf{y}, \mathbf{y})\rho^{2} g(\mathbf{x}) \mathrm{d} \mathbf{x} \mathrm{d}\mathbf{y},\]for any non-negative smooth function \(f\) with compact support.
For more details, we refer to [HGBLachiezeR22], (Section 2).
See also
interpolate()plot()
- structure_factor.pair_correlation_function.interpolate(r, pcf_r, clean=True, drop=True, replace=False, nan=0.0, posinf=0.0, neginf=0.0, extrapolate_with_one=True, **params)[source]
Interpolate and then extrapolate the evaluation
pcf_rof the pair correlation function (pcf)r.The interpolation is performed with scipy.interpolate.interp1d.
- Parameters
r (numpy.ndarray) – Vector of radii. Typically, the first column of the output of
estimate().pcf_r (numpy.ndarray) – Vector of evaluations of the pair correlation function at
r. Typically, a column from the output ofestimate().clean (bool, optional) – If
True, a method is chosen to deal with possible outliers (nan, posinf, neginf) ofpcf_r. The chosen method depends on the parametersreplaceanddrop. Defaults to True.drop (bool, optional) – Cleaning method for
pcf_ractive when it’s set to True simultaneously withclean=True. Drops possible nan, posinf, and neginf frompcf_rwith the corresponding values ofr.replace (bool, optional) – Cleaning method for
pcf_ractive when it’s set to True simultaneously withclean=True. Replaces possible nan, posinf, and neginf values ofpcf_rby the values set in the corresponding arguments. Defaults to True.nan (float, optional) – When
replace=True, replacing value of nan present inpcf_r. Defaults to 0.0.posinf (float, optional) – When
replace=True, replacing value of +inf values present inpcf_r. Defaults to 0.0.neginf (float, optional) – When is
replace=True, replacing value of -inf present inpcf_r. Defaults to 0.0.extrapolate_with_one (bool, optional) –
If True, the discrete approximation vector
pcf_ris first interpolated until the maximal value ofr, then the extrapolated values are fixed to 1. If False, the extrapolation method of scipy.interpolate.interp1d is used. Note that, the approximation of the structure factor by Ogata quadrature Hankel transform is usually better when set to True. Defaults to True.
- Keyword Arguments
params (dict) –
Keyword arguments of the function scipy.interpolate.interp1d.
- Returns
Interpolated pair correlation function.
- Return type
callable
Example
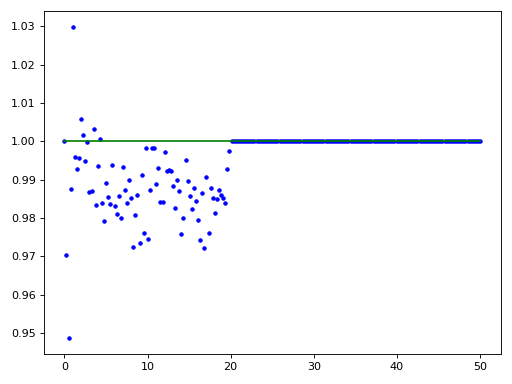
import matplotlib.pyplot as plt
import numpy as np

import structure_factor.pair_correlation_function as pcf
from structure_factor.point_pattern import PointPattern
from structure_factor.point_processes import HomogeneousPoissonPointProcess
from structure_factor.spatial_windows import BallWindow

point_process = HomogeneousPoissonPointProcess(intensity=1)
window = BallWindow(center=[0, 0], radius=40)
point_pattern = point_process.generate_point_pattern(window=window)

pcf_estimated = pcf.estimate(
    point_pattern, method="fv", Kest=dict(rmax=20), fv=dict(method="c", spar=0.2)
)

# Interpolate/extrapolate the results
r = pcf_estimated["r"]
pcf_r = pcf_estimated["pcf"]
pcf_interpolated = pcf.interpolate(
    r=r,
    pcf_r=pcf_r,
    drop=True,
)

x = np.linspace(0, 50, 200)
plt.plot(x, pcf_interpolated(x), "b.")
plt.plot(x, point_process.pair_correlation_function(x), "g")
plt.tight_layout(pad=1)
(Source code, png, hires.png, pdf)

See also
estimate()
- structure_factor.pair_correlation_function.plot(pcf_dataframe, exact_pcf=None, file_name='', **kwargs)[source]
Plot the columns of
pcf_dataframewith respect to the columnpcf_dataframe["r"].- Parameters
pcf_dataframe (pandas.DataFrame) – DataFrame to be visualized. Typically the output of
estimate().exact_pcf (callable) – Theoretical pair correlation function of the point process.
file_name (str) – Name used to save the figure. The available output formats depend on the backend being used.
- Keyword Arguments
kwargs (dict) – Keyword arguments of the function pandas.DataFrame.plot.line.
- Returns
Plot result.
- Return type
plt.Axes