Spatial windows
Collection of classes representing observation windows (box, ball, etc).
BallWindow: Ball window object.BoxWindow: Box window object.
- class structure_factor.spatial_windows.AbstractSpatialWindow[source]
Bases:
objectEncapsulate the notion of spatial window in \(\mathbb{R}^d\).
- abstract property dimension
Return the ambient dimension of the corresponding window.
- abstract property volume
Compute the volume of the corresponding window.
- indicator_function(points)[source]
Return the indicator function of the corresponding window evaluated at each of the \(n\)
points.- Parameters
points (numpy.ndarray) – Vector of size \(d\) or array of size \(n \times d\) containing the point(s) to be tested.
- Returns
If \(n=1\), bool.
If \(n>1\), \(n\) dimensional boolean array.
- Return type
bool or numpy.ndarray
- abstract rand(n=1, seed=None)[source]
Generate n points uniformly at random in the corresponding spatial window.
- Parameters
n (int, optional) – Number of points. Defaults to 1.
seed (int or np.random.Generator, optional) – Defaults to None.
- Returns
If \(n=1\), \(d\) dimensional vector.
If \(n>1\), \(n \times d\) array containing the points.
- Return type
numpy.ndarray
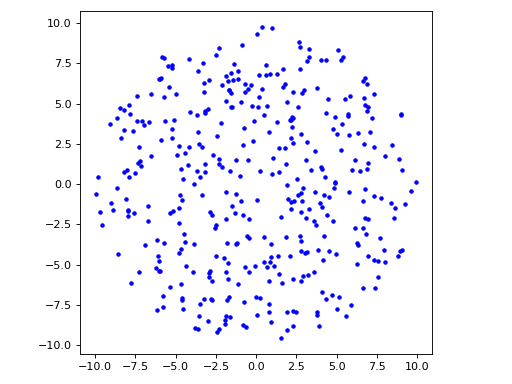
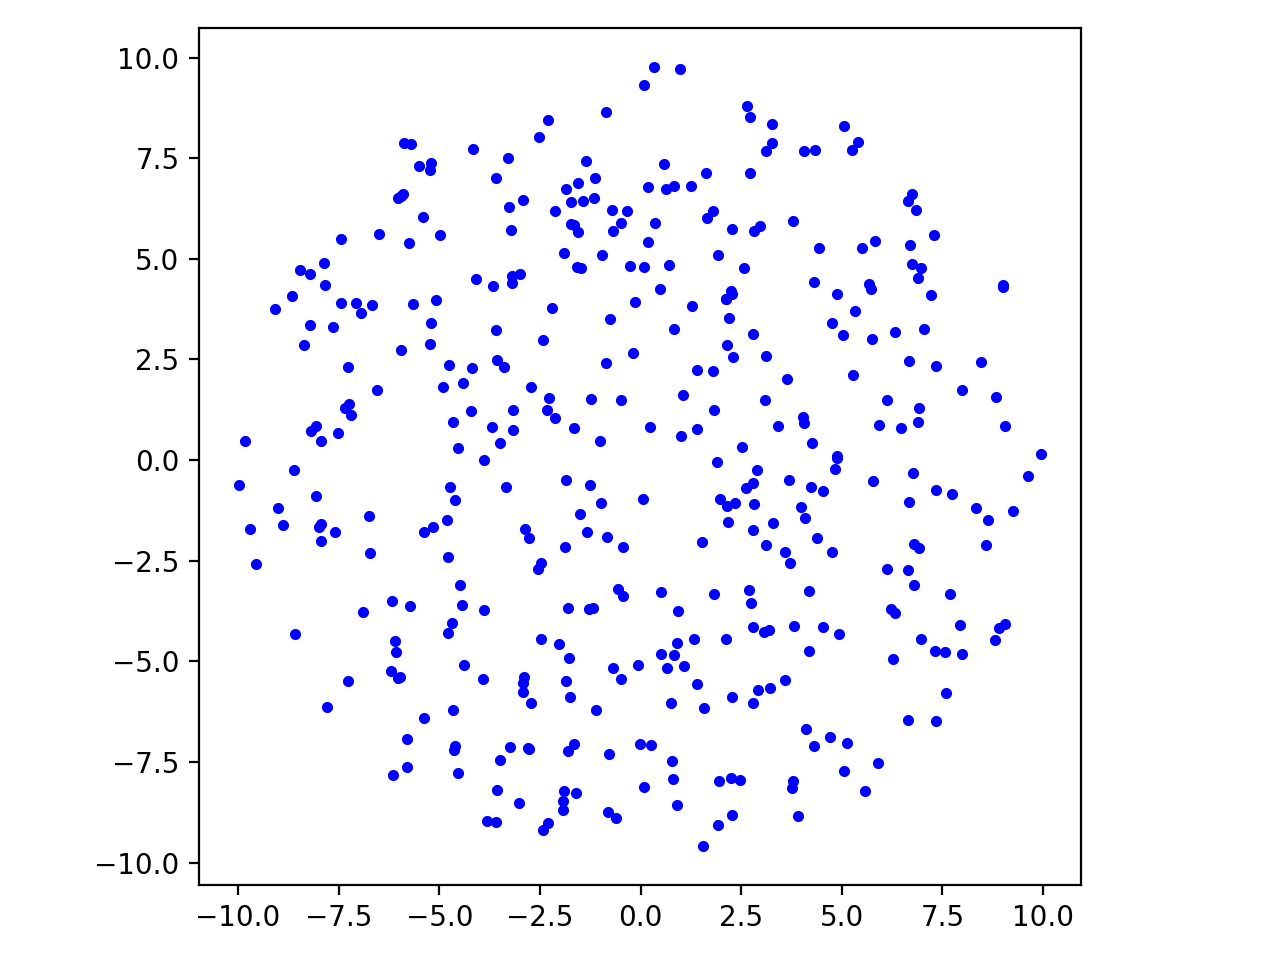
- class structure_factor.spatial_windows.BallWindow(center, radius=1.0)[source]
Bases:
structure_factor.spatial_windows.AbstractSpatialWindowCreate a \(d\) dimensional ball window \(B(c, r)\), where \(c \in \mathbb{R}^d\) and \(r>0\).
Example
import matplotlib.pyplot as plt

from structure_factor.spatial_windows import BallWindow

window = BallWindow(radius=10, center=[0, 0])
points = window.rand(n=400)

fig, ax = plt.subplots()
ax.plot(points[:, 0], points[:, 1], "b.")
ax.set_aspect("equal", "box")
plt.tight_layout(pad=1)
(Source code, png, hires.png, pdf)

See also
- __init__(center, radius=1.0)[source]
Initialize a \(d\) dimensional ball window \(B(c, r)\) from the prescribed
centerandradius.- Parameters
center (numpy.ndarray) – Center \(c\) of the ball.
radius (float, optional) – Radius \(r > 0\) of the ball. Defaults to 1.0.
- property dimension
Return the ambient dimension of the corresponding window.
- property volume
Compute the volume of the corresponding window.
- indicator_function(points)[source]
Return the indicator function of the corresponding window evaluated at each of the \(n\)
points.- Parameters
points (numpy.ndarray) – Vector of size \(d\) or array of size \(n \times d\) containing the point(s) to be tested.
- Returns
If \(n=1\), bool.
If \(n>1\), \(n\) dimensional boolean array.
- Return type
bool or numpy.ndarray
- rand(n=1, seed=None)[source]
Generate n points uniformly at random in the corresponding spatial window.
- Parameters
n (int, optional) – Number of points. Defaults to 1.
seed (int or np.random.Generator, optional) – Defaults to None.
- Returns
If \(n=1\), \(d\) dimensional vector.
If \(n>1\), \(n \times d\) array containing the points.
- Return type
numpy.ndarray
- to_spatstat_owin(**params)[source]
Convert the object to a
spatstat.geom.discR object of typedisc, which is a subtype ofowin.- Parameters
params (dict) – Optional keyword arguments passed to
spatstat.geom.disc.- Returns
R object.
- Return type
spatstat.geom.disc
- plot(axis=None, **kwargs)[source]
Display the window on matplotlib axis.
- Parameters
axis (plt.Axes, optional) – Support axis of the plot. Defaults to None.
- Keyword Arguments
kwargs (dict) – Keyword arguments of
matplotlib.patches.Circlewith defaultfill=False.- Returns
Plot axis.
- Return type
plt.Axes
- class structure_factor.spatial_windows.UnitBallWindow(center)[source]
Bases:
structure_factor.spatial_windows.BallWindowCreate a d-dimensional unit ball window \(B(c, r=1)\), where \(c \in \mathbb{R}^d\).
Note
UnitBallWindow(center) = BallWindow(center, radius=1.0)- __init__(center)[source]
Initialize a \(d\) dimensional unit ball window \(B(c, r=1)\) from the prescribed
center.- Parameters
center (numpy.ndarray, optional) – Center \(c\) of the ball.
- property dimension
Return the ambient dimension of the corresponding window.
- indicator_function(points)
Return the indicator function of the corresponding window evaluated at each of the \(n\)
points.- Parameters
points (numpy.ndarray) – Vector of size \(d\) or array of size \(n \times d\) containing the point(s) to be tested.
- Returns
If \(n=1\), bool.
If \(n>1\), \(n\) dimensional boolean array.
- Return type
bool or numpy.ndarray
- plot(axis=None, **kwargs)
Display the window on matplotlib axis.
- Parameters
axis (plt.Axes, optional) – Support axis of the plot. Defaults to None.
- Keyword Arguments
kwargs (dict) – Keyword arguments of
matplotlib.patches.Circlewith defaultfill=False.- Returns
Plot axis.
- Return type
plt.Axes
- rand(n=1, seed=None)
Generate n points uniformly at random in the corresponding spatial window.
- Parameters
n (int, optional) – Number of points. Defaults to 1.
seed (int or np.random.Generator, optional) – Defaults to None.
- Returns
If \(n=1\), \(d\) dimensional vector.
If \(n>1\), \(n \times d\) array containing the points.
- Return type
numpy.ndarray
- to_spatstat_owin(**params)
Convert the object to a
spatstat.geom.discR object of typedisc, which is a subtype ofowin.- Parameters
params (dict) – Optional keyword arguments passed to
spatstat.geom.disc.- Returns
R object.
- Return type
spatstat.geom.disc
- property volume
Compute the volume of the corresponding window.
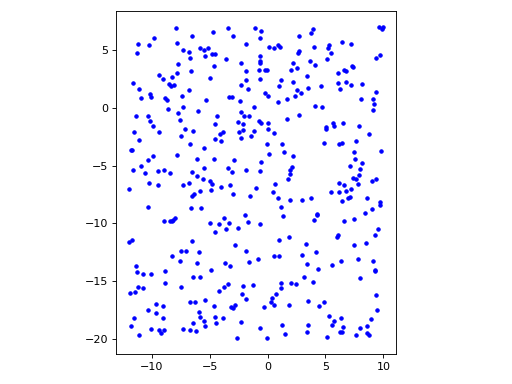
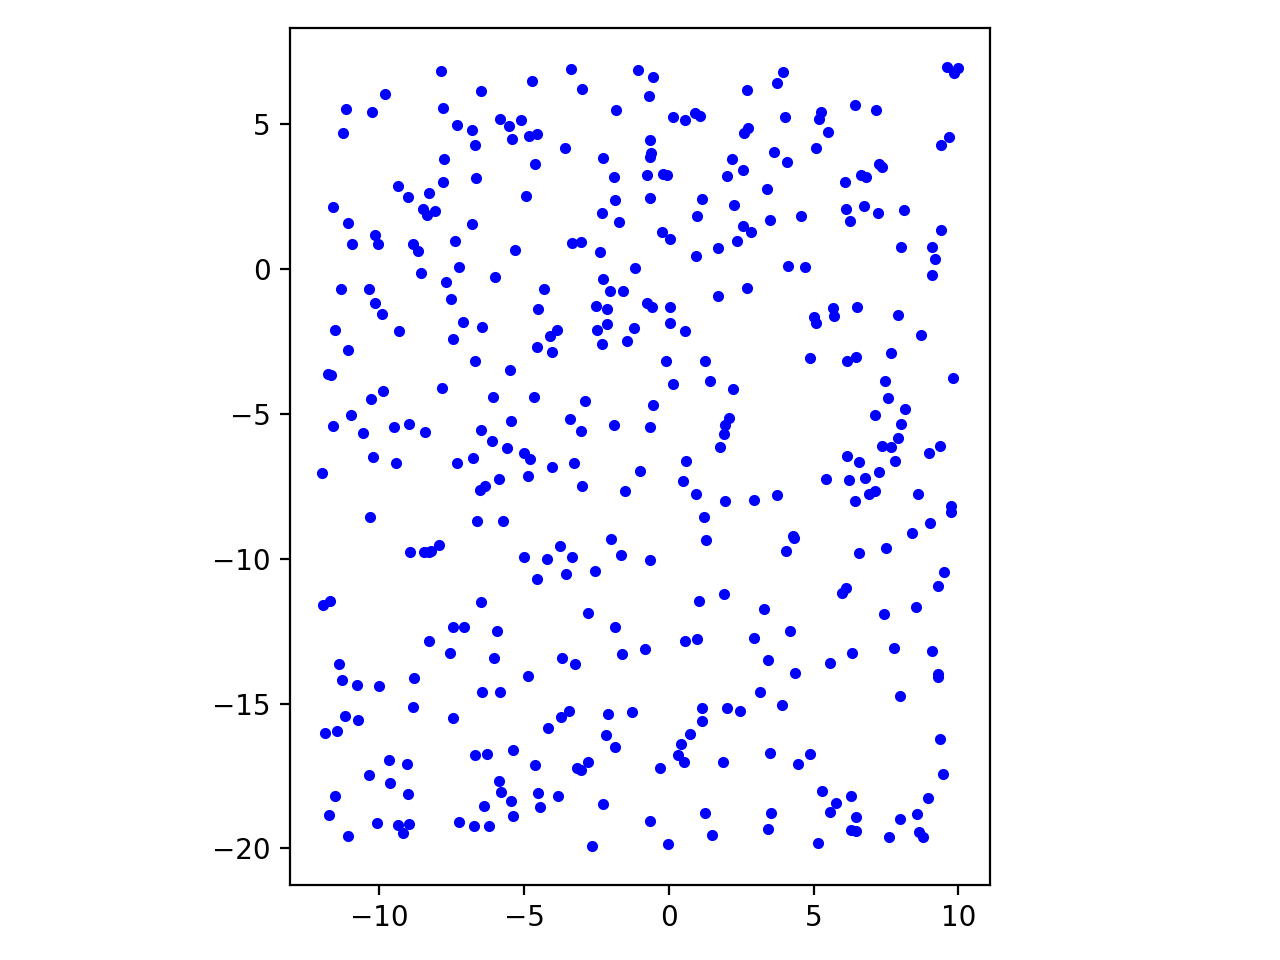
- class structure_factor.spatial_windows.BoxWindow(bounds)[source]
Bases:
structure_factor.spatial_windows.AbstractSpatialWindowCreate a \(d\) dimensional box window \(\prod_{i=1}^{d} [a_i, b_i]\).
Example
import matplotlib.pyplot as plt

from structure_factor.spatial_windows import BoxWindow

window = BoxWindow(bounds=[[-12, 10], [-20, 7]])
points = window.rand(n=400)

fig, ax = plt.subplots()
ax.plot(points[:, 0], points[:, 1], "b.")
ax.set_aspect("equal", "box")
plt.tight_layout(pad=1)
(Source code, png, hires.png, pdf)

See also
- __init__(bounds)[source]
Initialize \(d\) dimensional unit box window the prescibed
bounds[i, :]\(=[a_i, b_i]\).- Parameters
bounds (numpy.ndarray) – \(d \times 2\) array describing the bounds of the box.
- property bounds
Return the bounds decribing the BoxWindow.
bounds[i, :]\(=[a_i, b_i]\).
- property dimension
Return the ambient dimension of the corresponding window.
- property volume
Compute the volume of the corresponding window.
- indicator_function(points)[source]
Return the indicator function of the corresponding window evaluated at each of the \(n\)
points.- Parameters
points (numpy.ndarray) – Vector of size \(d\) or array of size \(n \times d\) containing the point(s) to be tested.
- Returns
If \(n=1\), bool.
If \(n>1\), \(n\) dimensional boolean array.
- Return type
bool or numpy.ndarray
- rand(n=1, seed=None)[source]
Generate n points uniformly at random in the corresponding spatial window.
- Parameters
n (int, optional) – Number of points. Defaults to 1.
seed (int or np.random.Generator, optional) – Defaults to None.
- Returns
If \(n=1\), \(d\) dimensional vector.
If \(n>1\), \(n \times d\) array containing the points.
- Return type
numpy.ndarray
- to_spatstat_owin(**params)[source]
Convert the object to a
spatstat.geom.owinR object of typeowin.- Parameters
params (dict) – Optional keyword arguments passed to
spatstat.geom.owin.- Returns
R object.
- Return type
spatstat.geom.owin
- plot(axis=None, **kwargs)[source]
Display the window on matplotlib axis.
- Parameters
axis (plt.Axes, optional) – Support axis of the plot. Defaults to None.
- Keyword Arguments
kwargs (dict) – Keyword arguments of
matplotlib.patches.Rectanglewith defaultfill=False.- Returns
Plot axis.
- Return type
plt.Axes
- class structure_factor.spatial_windows.UnitBoxWindow(center)[source]
Bases:
structure_factor.spatial_windows.BoxWindowCreate a \(d\) dimensional unit box window \(\prod_{i=1}^{d} [c_i - \frac{1}{2}, c_i + \frac{1}{2}]\) where \(c \in \mathbb{R}^d\).
- __init__(center)[source]
Initialize a \(d\) dimensional unit box window \(\prod_{i=1}^{d} [c_i - \frac{1}{2}, c_i + \frac{1}{2}]\), i.e., a box window with length equal to 1 and prescribed
center, such that \(c_i=\)center[i].- Parameters
center (numpy.ndarray) – Center \(c\) of the box.
- property bounds
Return the bounds decribing the BoxWindow.
bounds[i, :]\(=[a_i, b_i]\).
- property dimension
Return the ambient dimension of the corresponding window.
- indicator_function(points)
Return the indicator function of the corresponding window evaluated at each of the \(n\)
points.- Parameters
points (numpy.ndarray) – Vector of size \(d\) or array of size \(n \times d\) containing the point(s) to be tested.
- Returns
If \(n=1\), bool.
If \(n>1\), \(n\) dimensional boolean array.
- Return type
bool or numpy.ndarray
- plot(axis=None, **kwargs)
Display the window on matplotlib axis.
- Parameters
axis (plt.Axes, optional) – Support axis of the plot. Defaults to None.
- Keyword Arguments
kwargs (dict) – Keyword arguments of
matplotlib.patches.Rectanglewith defaultfill=False.- Returns
Plot axis.
- Return type
plt.Axes
- rand(n=1, seed=None)
Generate n points uniformly at random in the corresponding spatial window.
- Parameters
n (int, optional) – Number of points. Defaults to 1.
seed (int or np.random.Generator, optional) – Defaults to None.
- Returns
If \(n=1\), \(d\) dimensional vector.
If \(n>1\), \(n \times d\) array containing the points.
- Return type
numpy.ndarray
- to_spatstat_owin(**params)
Convert the object to a
spatstat.geom.owinR object of typeowin.- Parameters
params (dict) – Optional keyword arguments passed to
spatstat.geom.owin.- Returns
R object.
- Return type
spatstat.geom.owin
- property volume
Compute the volume of the corresponding window.
- structure_factor.spatial_windows.check_cubic_window(window)[source]
Check whether
windowis cubic.- Parameters
window (
BoxWindow) – Window to be checked.
Example
from structure_factor.spatial_windows import BoxWindow, check_cubic_window

# Example 1:
window = BoxWindow(bounds=[[-1, 5], [-1, 2]])
check_cubic_window(window)

# Example 2:
window = BoxWindow(bounds=[[-1, 2], [-1, 2], [-1, 2]])
check_cubic_window(window)
- structure_factor.spatial_windows.check_centered_window(window)[source]
Check whether
windowis centered at the origin.- Parameters
window (
AbstractSpatialWindow) – Window to be checked.
Example
from structure_factor.spatial_windows import (
    BoxWindow,
    BallWindow,
    check_centered_window,
)

# Example 1:
window = BoxWindow(bounds=[[-1, 5], [-1, 2]])
check_centered_window(window)

# Example 2:
window = BallWindow(center=[0, 0], radius=5)
check_centered_window(window)
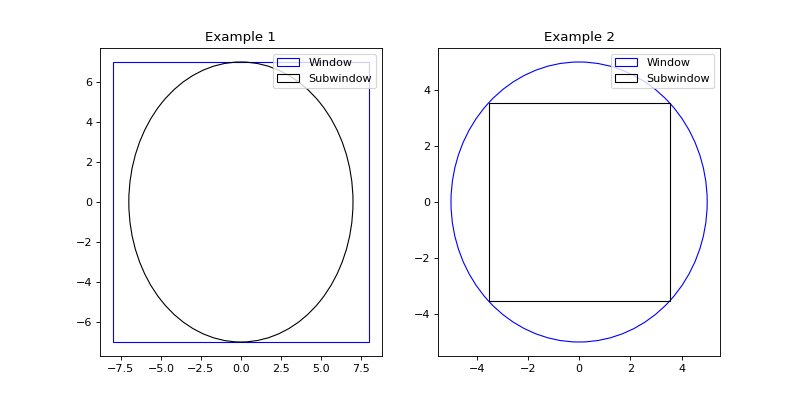
- structure_factor.spatial_windows.subwindow_parameter_max(window, subwindow_type='BoxWindow')[source]
Return the parameter i.e., lengthside (resp. radius) of the largest cubic (resp. ball) subwindow of
window.- Parameters
window (
AbstractSpatialWindow) – BoxWindow or BallWindow centered at the origin.subwindow_type (str, optional) – Type of the subwindow (“BoxWindow” or “BallWindow”). Defaults to “BoxWindow”.
- Returns
Parameter of the largest subwindow of
window.- Return type
float
Example
from structure_factor.spatial_windows import (
    BoxWindow,
    BallWindow,
    subwindow_parameter_max,
)

# Example 1:
window1 = BoxWindow([[-8, 8], [-7, 7]])
r = subwindow_parameter_max(window=window1, subwindow_type="BallWindow")
subwindow1 = BallWindow(center=[0,0], radius=r)
# Example 2:
window2 = BallWindow(center=[0, 0], radius=5)
l = subwindow_parameter_max(window=window2)
subwindow2 = BoxWindow([[-l/2,l/2]]*2)

import matplotlib.pyplot as plt
fig, axis = plt.subplots(1, 2, figsize=(10,5))
axis[0].plot(0,0)
window1.plot(axis=axis[0], color="b", label="Window")
subwindow1.plot(axis=axis[0], color="k", label="Subwindow")
axis[0].legend()
axis[0].title.set_text("Example 1")

axis[1].plot(0,0)
window2.plot(axis=axis[1], color="b", label="Window")
subwindow2.plot(axis=axis[1], color="k", label="Subwindow")
axis[1].legend()
axis[1].title.set_text("Example 2")

plt.show()
(Source code, png, hires.png, pdf)