Point processes
Collection of point processes at related properties, e.g., intensity, pair correlation function, structure factor.
HomogeneousPoissonPointProcess: The homogeneous Poisson point process.ThomasPointProcess: The Thomas point process.GinibrePointProcess: The Ginibre point process.mutual_nearest_neighbor_matching(): The matching process of [KLY20].
- class structure_factor.point_processes.HomogeneousPoissonPointProcess(intensity=1.0)[source]
Bases:
objectHomogeneous Poisson point process.
- __init__(intensity=1.0)[source]
Create a homogeneous Poisson point process with prescribed (positive)
intensityparameter.- Parameters
intensity (float, optional) – intensity of the homogeneous Poisson point process. Defaults to 1.0.
- property intensity
Return the intensity \(\rho_1(r) = \rho\) of the homogeneous Poisson point process.
- Returns
Constant intensity.
- Return type
float
- static pair_correlation_function(r=None)[source]
Evaluate the pair correlation function \(g(r)=1\) of the homogeneous Poisson process.
- Parameters
r (numpy.ndarray) – Array of size \(n \times d\), where \(d\) is the ambient dimension and \(n\) the number of points where the pair correlation function is evaluated. Since the homogeneous Poisson process is isotropic, a vector of size \(n\) corresponding to the norm of the \(n\) points can also be passed. Defaults to None.
- Returns
1.0ifr=None, otherwise a vector of size \(n\) with entries equal to1.0.- Return type
float or numpy.ndarray
- static structure_factor(k=None)[source]
Evaluate the structure factor \(S(k)=1\) of the homogeneous Poisson process.
- Parameters
k (numpy.ndarray) – Array of size \(n \times d\), where \(d\) is the ambient dimension and \(n\) the number of points where the structure factor is evaluated. Since the homogeneous Poisson process is isotropic, a vector of size \(n\) corresponding to the norm of the \(n\) points can also be passed. Defaults to None.
- Returns
1.0ifk=None, otherwise a vector of size \(n\) with entries equal to1.0.- Return type
float or numpy.ndarray
- generate_sample(window, seed=None)[source]
Generate an exact sample of the point process restricted to the \(d\) dimensional window.
- Parameters
window (
AbstractSpatialWindow) – \(d\)-dimensional observation window where the points will be generated.- Returns
Array of size \(n \times d\), where \(n\) is the number of points forming the sample.
- Return type
numpy.ndarray
Example
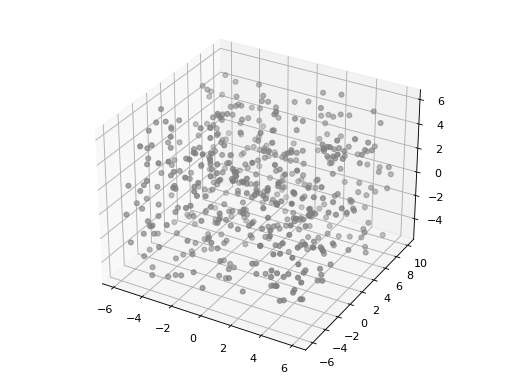
import matplotlib.pyplot as plt

from structure_factor.point_processes import HomogeneousPoissonPointProcess
from structure_factor.spatial_windows import BoxWindow

point_process = HomogeneousPoissonPointProcess(intensity=0.25)

window = BoxWindow([[-6, 6], [-6, 10], [-5, 6]])
points = point_process.generate_sample(window)

ax = plt.axes(projection="3d")
ax.scatter3D(points[:, 0], points[:, 1], points[:, 2], c="grey")

plt.tight_layout(pad=1)
(Source code, png, hires.png, pdf)

See also
- generate_point_pattern(window, seed=None)[source]
Generate a
PointPatternof the point process.- Parameters
window (
AbstractSpatialWindow) – Observation window.seed (int, optional) – Seed to initialize the points generator. Defaults to None.
- Returns
Object of type
PointPatterncontaining a realization of the point process, the observation window, and (optionally) the intensity of the point process (seePointPattern).- Return type
Example
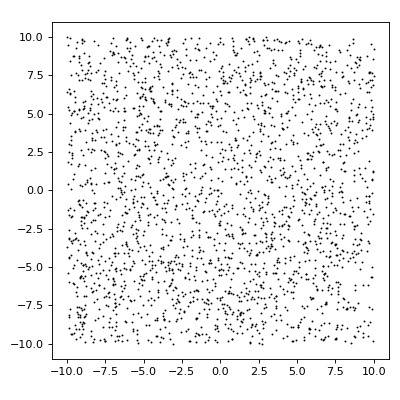
import matplotlib.pyplot as plt

from structure_factor.point_processes import HomogeneousPoissonPointProcess
from structure_factor.spatial_windows import BoxWindow

point_process = HomogeneousPoissonPointProcess(intensity=6)

window = BoxWindow(bounds=[[-10, 10], [-10, 10]])
point_pattern = point_process.generate_point_pattern(window=window)

ax = point_pattern.plot()
ax.set_aspect("equal", "box")
plt.tight_layout(pad=1)
(Source code, png, hires.png, pdf)

See also
- class structure_factor.point_processes.ThomasPointProcess(kappa, mu, sigma)[source]
Bases:
objectHomogeneous Thomas point process with Gaussian clusters.
- __init__(kappa, mu, sigma)[source]
Create a homogeneous Thomas point process.
- Parameters
kappa (float) – Mean number of clusters per unit volume. Intensity of the parent Poisson point process.
mu (float) – Mean number of points per clusters. Mean of the child Gaussian distribution.
sigma (float) – Standard deviation of the child Gaussian distribution.
- property intensity
Return the intensity \(\rho_1(r) = \kappa \mu\) of the Thomas point process.
- Returns
Constant intensity.
- Return type
float
- pair_correlation_function(r_norm, d=2)[source]
Evaluate the pair correlation function of the Thomas point process.
\[g(r) = 1 + \kappa (4 \pi \sigma^2)^{d / 2} \exp(-\frac{1}{4\sigma^2} \|r\|^2)\]- Parameters
r_norm (numpy.ndarray) – Vector of size \(n\) corresponding to the norm of the \(n\) points where the pair correlation function is evaluated.
d (int, optional) – Ambient dimension. Defaults to 2.
- Returns
Vector of size \(n\) containing the evaluation of the pair correlation function.
- Return type
numpy.ndarray
- structure_factor(k_norm)[source]
Evaluate the structure factor of the Thomas point process.
\[S(k) = 1 + \mu \exp(- \sigma^2 * \|k\|^2).\]- Parameters
k_norm (numpy.ndarray) – Vector of size \(n\) corresponding to the norm of the \(n\) points where the structure factor is evaluated.
- Returns
Vector of size \(n\) containing the evaluation of the structure factor.
- Return type
numpy.ndarray
- generate_sample(window, seed=None)[source]
Generate an exact sample from the corresponding
ThomasPointProcessrestricted to the \(d\) dimensional window.- Parameters
window (
AbstractSpatialWindow) – \(d\)-dimensional observation window where the points will be generated.- Returns
Array of size \(n \times d\), where \(n\) is the number of points forming the sample.
- Return type
numpy.ndarray
Example
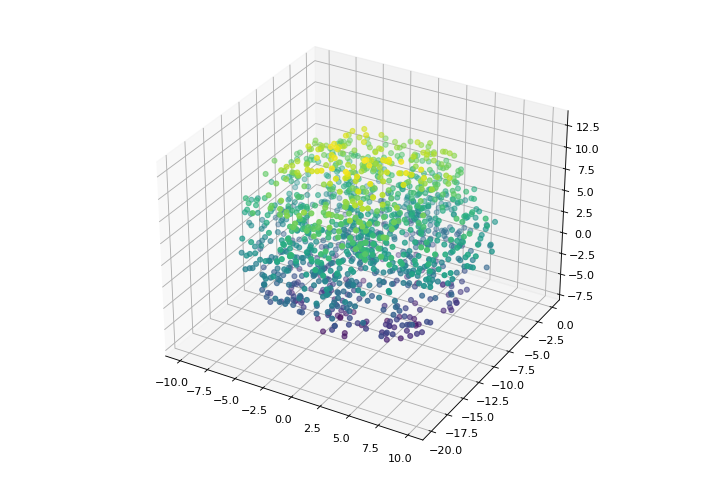
import matplotlib.pyplot as plt
import numpy as np

from structure_factor.point_processes import ThomasPointProcess
from structure_factor.spatial_windows import BallWindow

point_process = ThomasPointProcess(kappa=1 / (5 * np.pi), mu=5, sigma=1)

window = BallWindow(center=[0, -10, 3], radius=10)
points = point_process.generate_sample(window=window)

fig = plt.figure(figsize=(9, 6))
ax = plt.axes(projection="3d")
ax.scatter3D(points[:, 0], points[:, 1], points[:, 2], c=points[:, 2])

plt.tight_layout(pad=1)
(Source code, png, hires.png, pdf)
See also
- generate_point_pattern(window, seed=None)[source]
Generate a
PointPatternof the point process.- Parameters
window (
AbstractSpatialWindow) – Observation window.seed (int, optional) – Seed to initialize the points generator. Defaults to None.
- Returns
Object of type
PointPatterncontaining a realization of the point process, the observation window, and (optionally) the intensity of the point process (seePointPattern).- Return type
Example
import matplotlib.pyplot as plt
import numpy as np

from structure_factor.point_processes import ThomasPointProcess
from structure_factor.spatial_windows import BallWindow

point_process = ThomasPointProcess(kappa=1 / (20 * np.pi), mu=20, sigma=2)

window = BallWindow(center=[-20, -10], radius=50)
point_pattern = point_process.generate_point_pattern(window=window)

ax = point_pattern.plot()
ax.set_aspect("equal", "box")
plt.tight_layout(pad=1)
(Source code, png, hires.png, pdf)

See also
- class structure_factor.point_processes.GinibrePointProcess[source]
Bases:
objectGinibre point process corresponds to the complex eigenvalues of a standard complex Gaussian matrix.
- property intensity
Return the intensity \(\rho_1(r) = \frac{1}{\pi}\) of the Ginibre point process.
- Returns
Constant intensity.
- Return type
float
- static pair_correlation_function(r_norm)[source]
Evaluate the pair correlation function of the Ginibre point process.
\[g(r) = 1 - \exp(- \|r\|^2)\]- Parameters
r_norm (numpy.ndarray) – Vector of size \(n\) corresponding to the norm of the \(n\) points where the pair correlation function is evaluated.
- Returns
Vector of size \(n\) containing the evaluation of the pair correlation function.
- Return type
numpy.ndarray
- static structure_factor(k_norm)[source]
Evaluate the structure factor of the Ginibre point process.
\[S(k) = 1 - \exp(- \frac{1}{4} \|k\|^2).\]- Parameters
k_norm (numpy.ndarray) – Vector of size \(n\) corresponding to the norm of the \(n\) points where the structure factor is evaluated.
- Returns
Vector of size \(n\) containing the evaluation of the structure factor.
- Return type
numpy.ndarray
- generate_sample(window, n=None, seed=None)[source]
Generate a sample of the Ginibre point process made of
npoints, inside the observationwindow.This is done by computing the eigenvalues of a random matrix \(G\) of size \(n \times n\), filled with i.i.d. standard complex Gaussian variables, i.e.,
\[G_{ij} = \frac{1}{\sqrt{2}} (X_{ij} + \mathbf{i} Y_{ij}).\]- Parameters
window (
BallWindow) – \(2\)-dimensional centered ball window where the points will be generated.n (int, optional) – Number of points of the output sample. If
nis None (default), it is set to the integer part of \(\rho |W| = \frac{1}{\pi} |W|\). Defaults to None.
- Returns
Array of size \(n \times 2\), representing the \(n\) points forming the sample.
- Return type
numpy.ndarray
Example
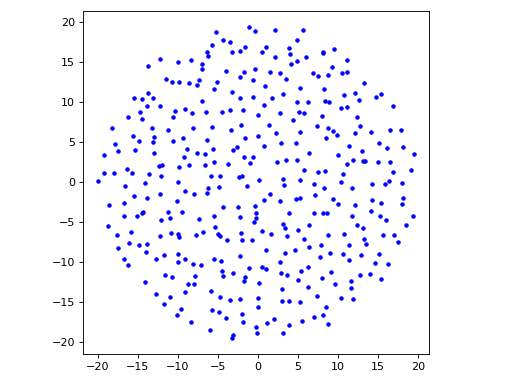
import matplotlib.pyplot as plt

from structure_factor.point_processes import GinibrePointProcess
from structure_factor.spatial_windows import BallWindow

point_process = GinibrePointProcess()

window = BallWindow(center=[0, 0], radius=20)
points = point_process.generate_sample(window=window)

fig, ax = plt.subplots()
ax.plot(points[:, 0], points[:, 1], "b.")
ax.set_aspect("equal", "box")
plt.tight_layout(pad=1)
(Source code, png, hires.png, pdf)

See also
- generate_point_pattern(window, n=None, seed=None)[source]
Generate a \(2\)-dimensional
PointPatternof the point process, with a centeredBallWindow.- Parameters
window (
AbstractSpatialWindow) – \(2\)-dimensional observation centeredBallWindow.n (int, optional) – Number of points of the output sample. If
nis None (default), it is set to the integer part of \(\rho |W| = \frac{1}{\pi} |W|\). Defaults to None.seed (int, optional) – Seed to initialize the points generator. Defaults to None.
- Returns
Object of type
PointPatterncontaining a realization of the point process, the observation window, and (optionally) the intensity of the point process (seePointPattern).- Return type
Example
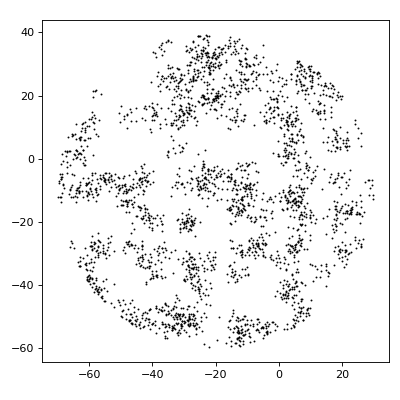
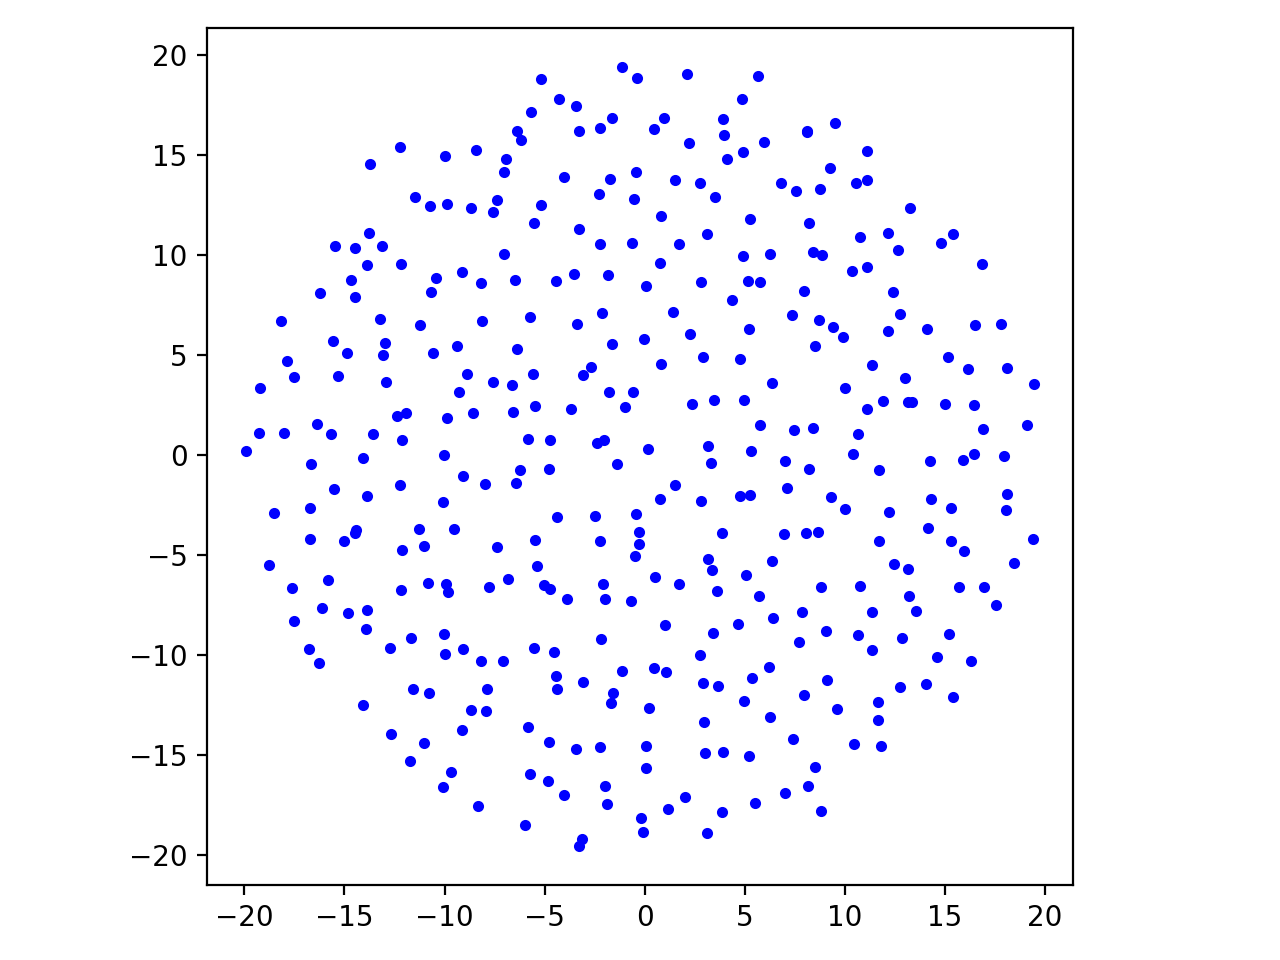
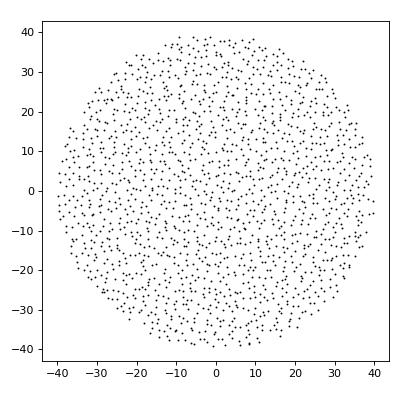
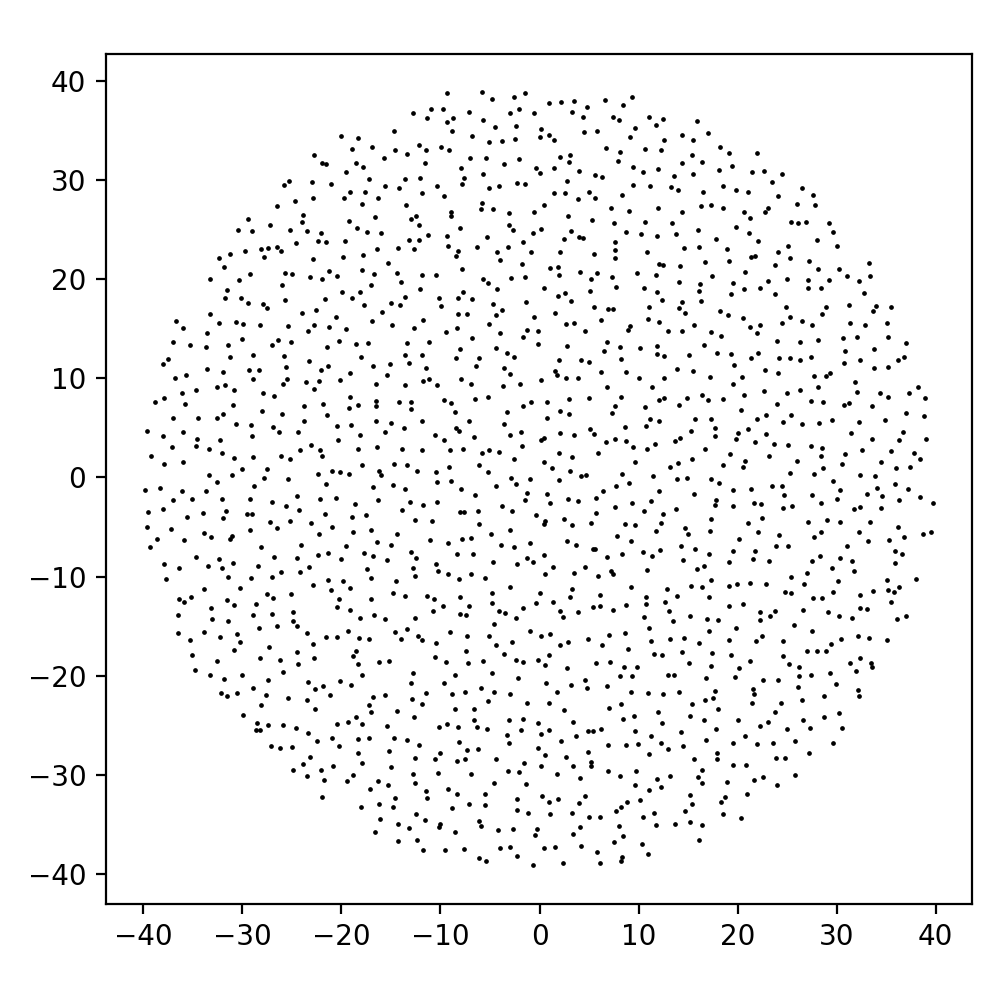
import matplotlib.pyplot as plt

from structure_factor import point_pattern
from structure_factor.point_processes import GinibrePointProcess
from structure_factor.spatial_windows import BallWindow

window = BallWindow(center=[0, 0], radius=40)
point_process = GinibrePointProcess()
point_pattern = point_process.generate_point_pattern(window=window)

ax = point_pattern.plot()
ax.set_aspect("equal", "box")
plt.tight_layout(pad=1)
(Source code, png, hires.png, pdf)

See also
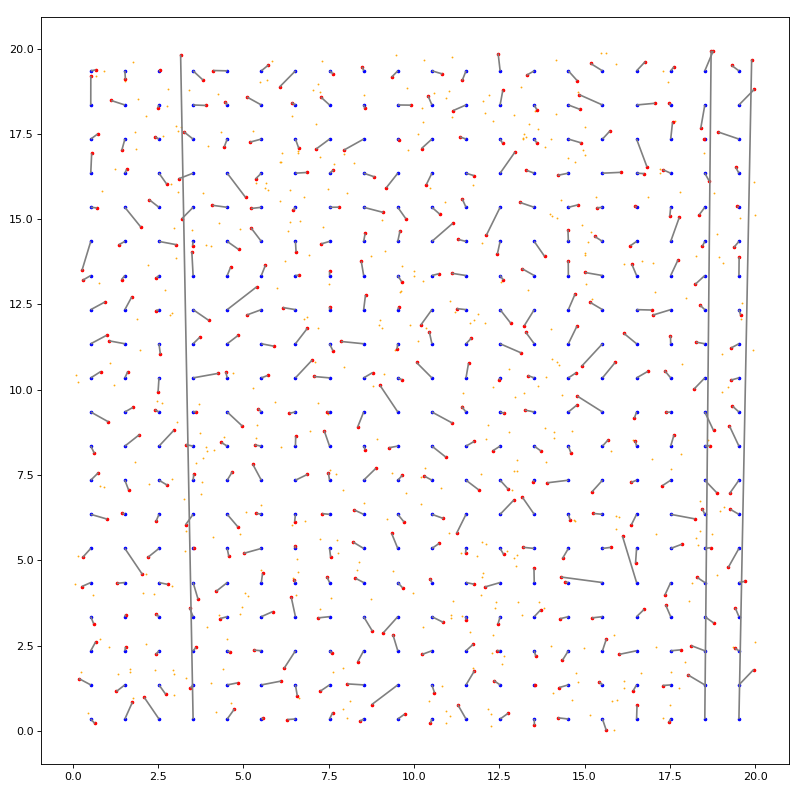
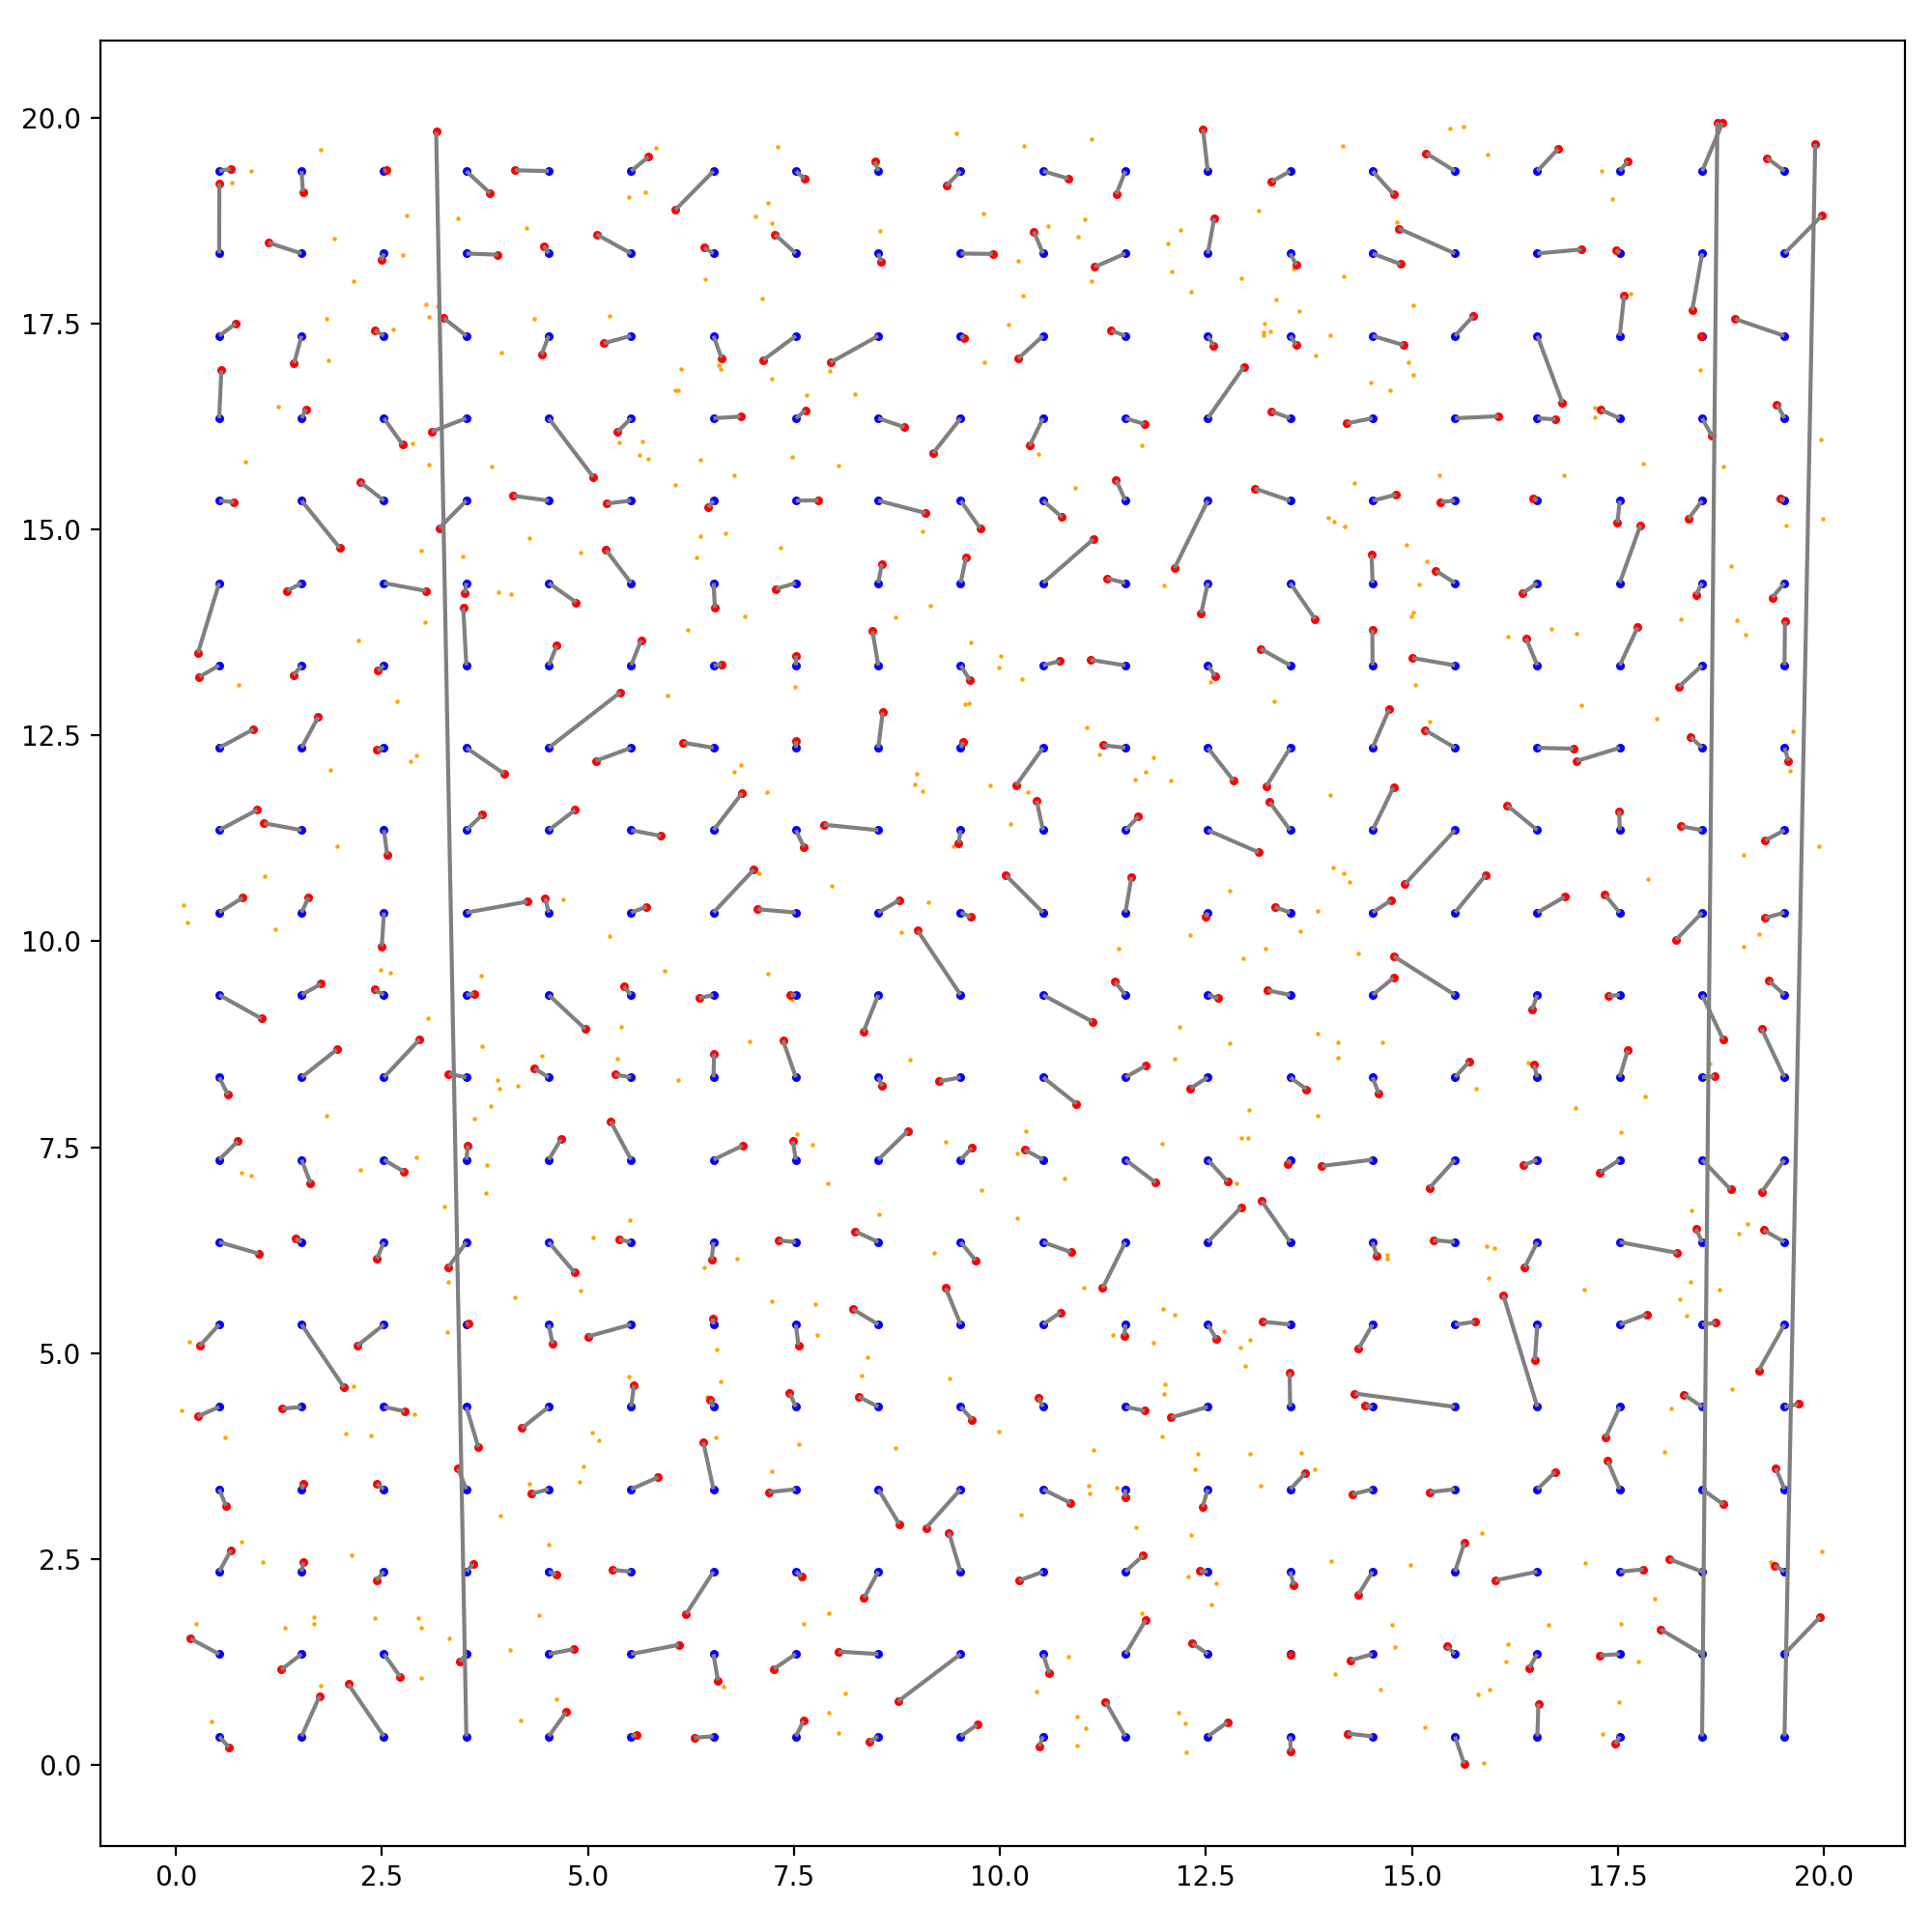
- structure_factor.point_processes.mutual_nearest_neighbor_matching(X, Y, **KDTree_params)[source]
Match the set of points
Xwith a subset of points fromYbased on mutual nearest neighbor matching [KLY20]. It is assumed that \(|X| \leq |Y|\) and that each point inX, resp.Y, can have only one nearest neighbor inY, resp.X.The matching routine involves successive 1-nearest neighbor sweeps performed by scipy.spatial.KDTree with the euclidean distance.
- Parameters
X (numpy.ndarray) – Array of size (m, d) collecting points to be matched with a subset of points from
Y.Y (numpy.ndarray) – Array of size (n, d) of points satisfying \(m \leq n\).
- Keyword Arguments
see (documentation) –
keyword arguments of scipy.spatial.KDTree.
Note
The
boxsizekeyword argument can be used only when points belong to a box \(\prod_{i=1}^{d} [0, L_i)\) (upper boundary excluded). It allows to consider periodic boundaries, i.e., the toroidal distance is used for searching for nearest neighbors.- Returns
vector of indices
matchessuch thatX[i]is matched toY[matches[i]].- Return type
numpy.ndarray
Example
import matplotlib.pyplot as plt
import numpy as np
from matplotlib.collections import LineCollection

from structure_factor.point_processes import (
    HomogeneousPoissonPointProcess,
    mutual_nearest_neighbor_matching,
)
from structure_factor.spatial_windows import BoxWindow
from structure_factor.utils import meshgrid_to_column_matrix

seed = None
rng = np.random.default_rng(seed)

bounds = np.array([[0, 20], [0, 20]])
window = BoxWindow(bounds)

# Perturbed grid
stepsize = 1.0
ranges = (np.arange(a, b, step=stepsize) for a, b in window.bounds)
X = meshgrid_to_column_matrix(np.meshgrid(*ranges))
shift = rng.uniform(0.0, stepsize, size=window.dimension)
X += shift

# Poisson
rho = (1 + 1) / (stepsize ** window.dimension)
ppp = HomogeneousPoissonPointProcess(rho)
Y = ppp.generate_sample(window, seed=rng)

# Mutual nearest neighbor matching
# To trigger periodic boundary conditions use boxsize
# make sure points belong to Π_i [0, L_i) (upper bound excluded)
boxsize = window.bounds[:, 1]  # default None
matching = mutual_nearest_neighbor_matching(X, Y, boxsize=boxsize)

# Display
fig, ax = plt.subplots(figsize=(10, 10))

ax.scatter(X[:, 0], X[:, 1], s=5, c="blue", label="grid")
ax.scatter(Y[:, 0], Y[:, 1], s=0.4, c="orange", label="Poisson")
ax.scatter(Y[matching, 0], Y[matching, 1], s=5, c="red", label="Poisson matched")
lines = LineCollection(
    [[x, y] for x, y in zip(X, Y[matching])], color="gray", label="matchings"
)
ax.add_collection(lines)

ax.set_aspect("equal", "box")
plt.tight_layout(pad=1)
(Source code, png, hires.png, pdf)

KLY matching